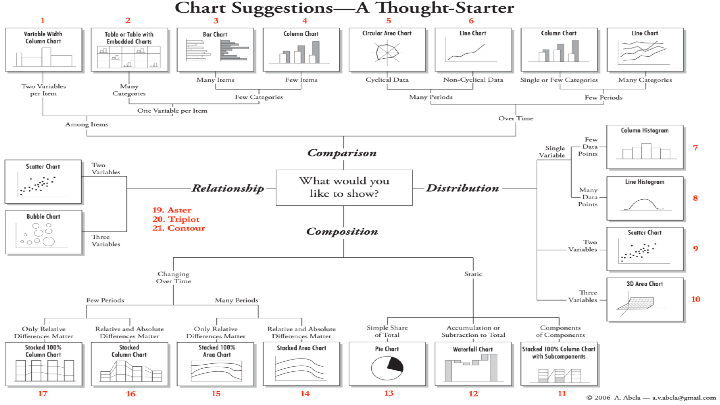
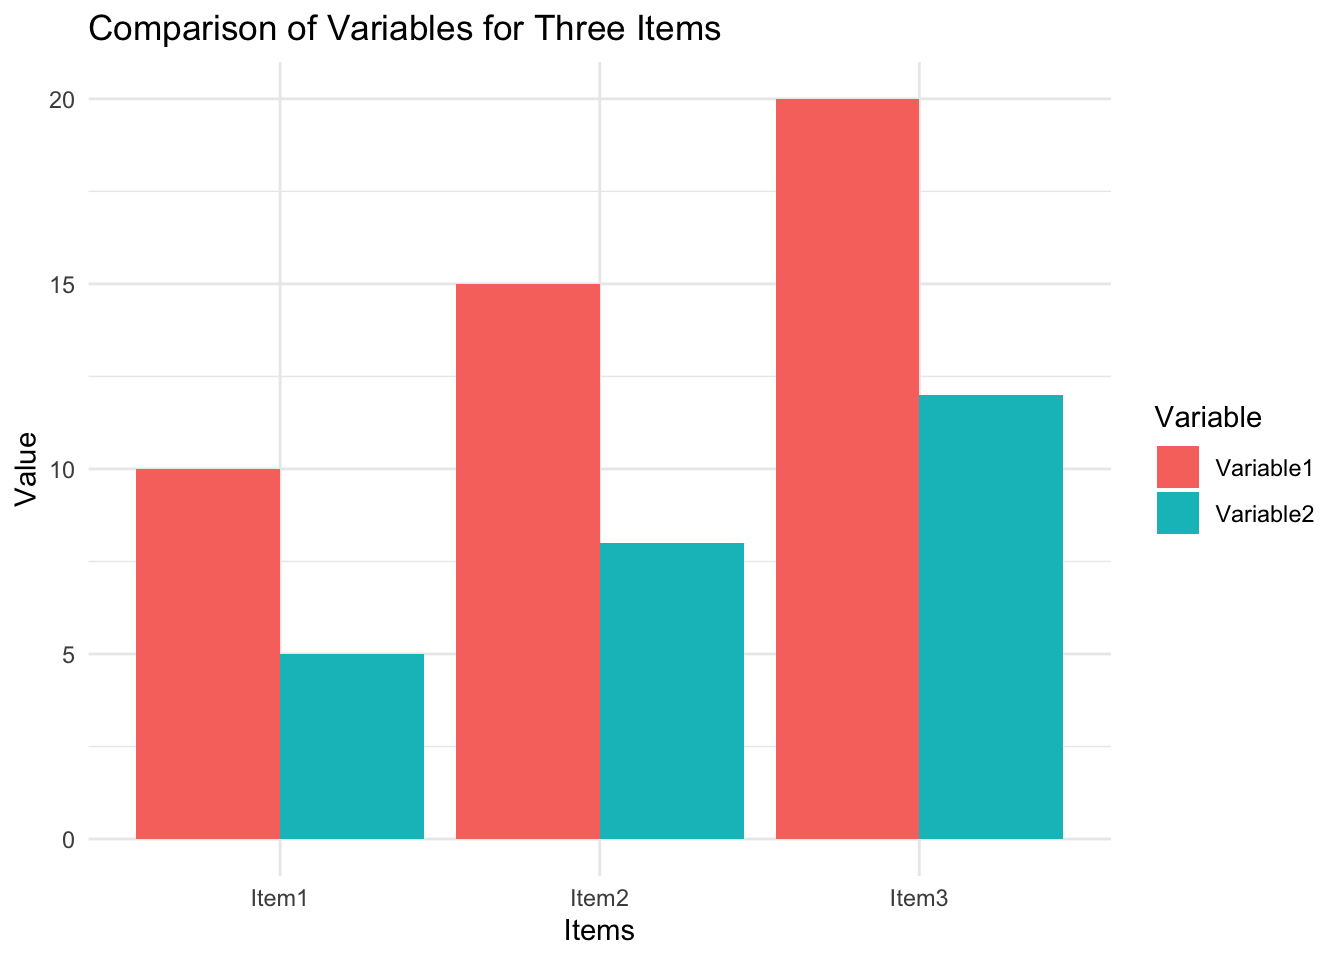
Chart #1 Variable Width Column Chart Attempt by Team Member Yichao Jin from “Chart Suggestions - A Thought Starter”
# Sample data framedata <-data.frame(Item =c("Item1", "Item2", "Item3"),Variable1 =c(10, 15, 20),Variable2 =c(5, 8, 12))# Load the ggplot2 librarylibrary(ggplot2)# Reshape the data from wide to long format using tidyrlibrary(tidyr)data_long <-pivot_longer(data, cols =starts_with("Variable"),names_to ="Variable",values_to ="Value")# Create the grouped bar chartggplot(data_long, aes(x = Item, y = Value, fill = Variable)) +geom_bar(stat ="identity", position =position_dodge(width =0.9)) +labs(title ="Comparison of Variables for Three Items",x ="Items",y ="Value") +theme_minimal()
Chart #2 Table or Table with Embedded Charts from “Chart Suggestions - A Thought Starter”
(Coming soon…)
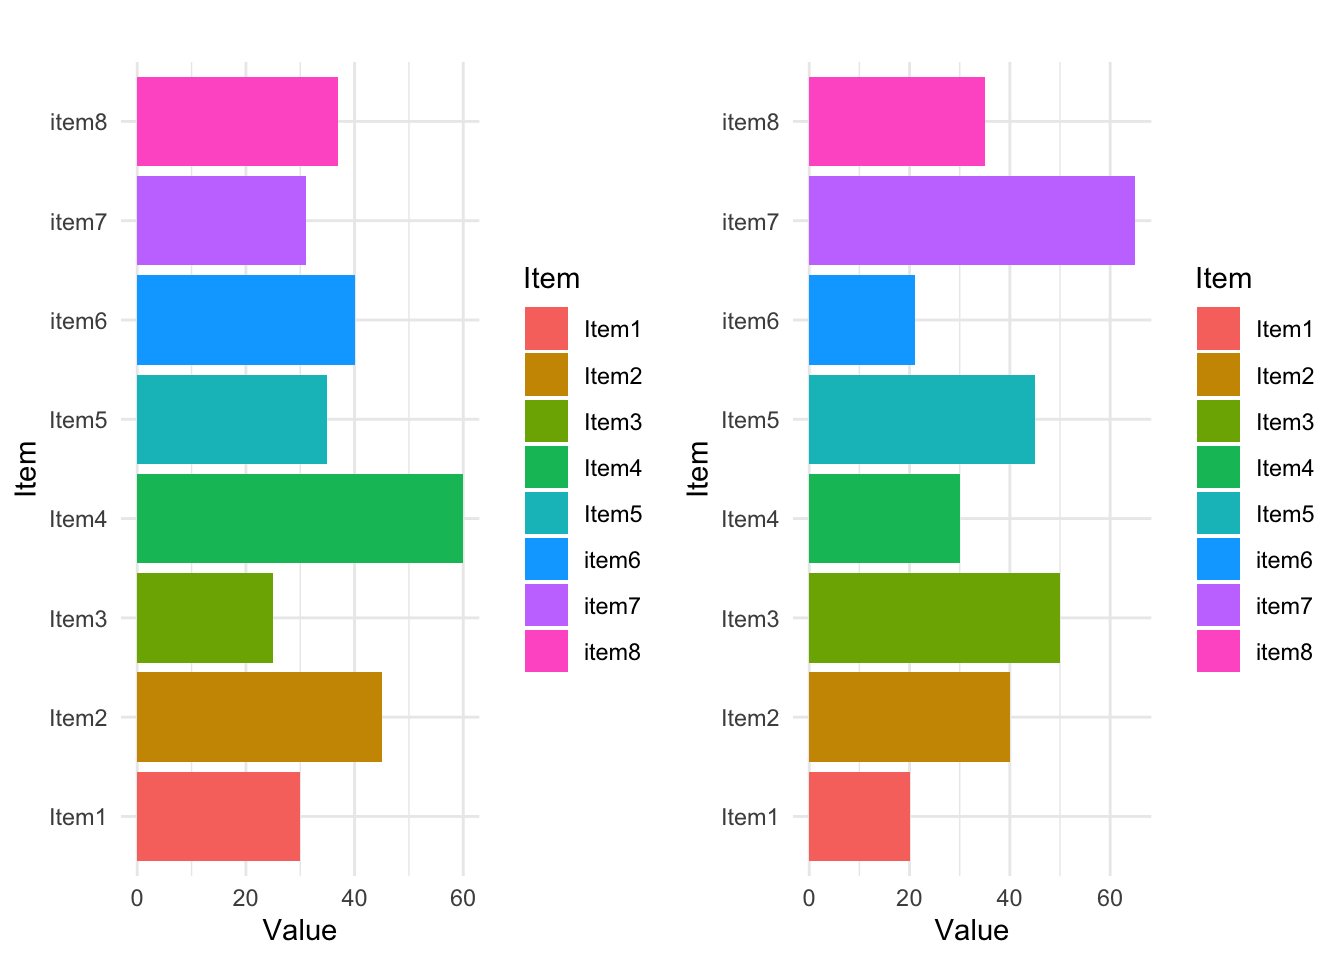
Chart #3 Bar Chart Attempt by Team Member Yichao Jin from “Chart Suggestions - A Thought Starter”
# Sample data framedata <-data.frame(Item =c("Item1", "Item2", "Item3", "Item4","Item5","item6","item7","item8"),Value1 =c(30, 45, 25, 60, 35,40,31,37),Value2 =c(20, 40, 50, 30, 45,21,65,35))# Load the ggplot2 librarylibrary(ggplot2)# Create the first horizontal bar chartchart1 <-ggplot(data, aes(x = Value1, y = Item, fill = Item)) +geom_bar(stat ="identity", orientation ="y") +labs(title ="", x ="Value", y ="Item") +theme_minimal() +theme(axis.text.y =element_text(hjust =1)) # Right-align item labels# Create the second horizontal bar chartchart2 <-ggplot(data, aes(x = Value2, y = Item, fill = Item)) +geom_bar(stat ="identity", orientation ="y") +labs(title ="", x ="Value", y ="Item") +theme_minimal() +theme(axis.text.y =element_text(hjust =1)) # Right-align item labels# Display the charts side by sidelibrary(gridExtra)grid.arrange(chart1, chart2, ncol =2)
Chart #4 Column Chart from “Chart Suggestions - A Thought Starter”